A few weeks ago I wrote a blog called From Hype to Reality: Talking Real-Time Voice Design with the Experts.
The conversation focused on voice experiences, customer journeys and how organisations can design better interactions.
But once the workshop finishes and the solution goes live, the next question usually arrives surprisingly quickly.
"What reporting do we get?" , then comes "Can we have another dashboard?", and then…"Can we build a Power BI report for that?"
Before long, the conversation isn't about customer experience anymore. It's about reports.
Lots of reports….. Sometimes so many reports that you start wondering who's actually looking at them all.
I have a confession to make, I quite like data, probably more than is healthy.
I enjoy understanding trends.
I enjoy finding patterns.
I enjoy seeing the story hidden beneath the numbers.
Which is why I completely understand why reporting becomes such a big conversation during Contact Centre implementations.
The problem i have begin to understand recently is that reporting often starts with the wrong question.
Instead of "What decisions are we trying to make?" the conversation quickly becomes "What data can we display?"
Those are two very different things.
Whenever reporting comes up, there's one question I find myself asking: What are you going to do differently because of this report?
If nobody knows the answer... There's a reasonable chance the report isn't actually solving a problem.
It's simply displaying information, and like i have already eluded to above there is a huge difference between information and insight.
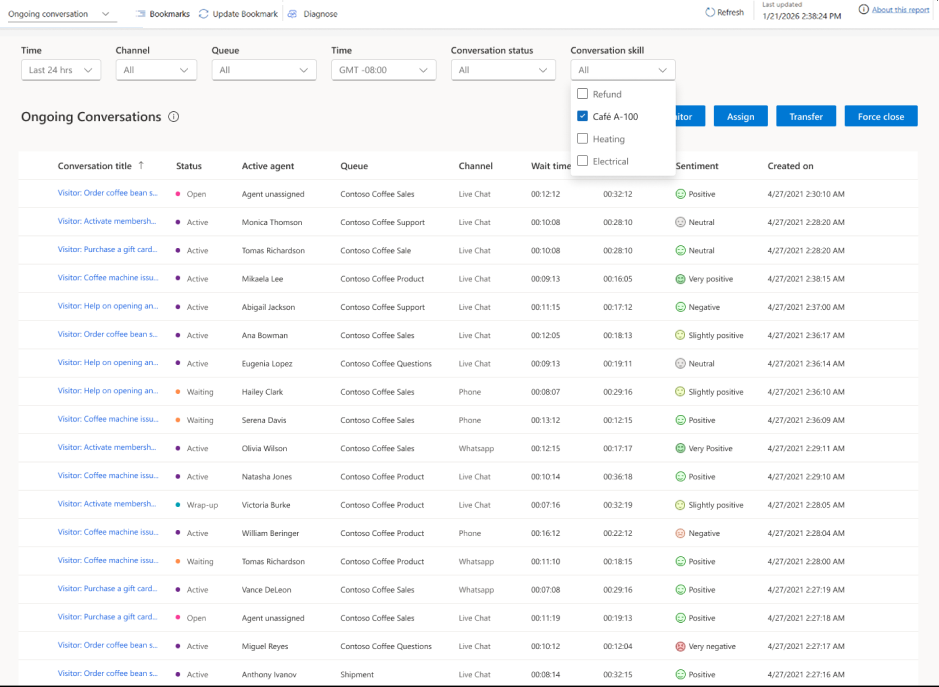
Dynamics 365 Contact Center Already Gives You A Lot
One of the biggest misconceptions I encounter during customer conversations is the assumption that Power BI is a day-one requirement.
In reality, Dynamics 365 Contact Center already provides a significant amount of operational reporting out of the box. Supervisors and operational teams can understand queue performance, service levels, abandonment, agent activity, channel performance, conversation trends, and a wide range of day-to-day metrics without needing to build a single custom dashboard.
For many organisations, especially during an initial implementation, that's more than enough, because the goal isn't to create the most visually impressive dashboard; the goal is to run the contact centre effectively.
Operational Reporting vs Strategic Reporting
This is where I think a lot of reporting conversations become unnecessarily complicated, not every reporting requirement belongs in Power BI.
Operational Reporting
Operational reporting is focused on the here and now.
Questions such as:
What's happening right now?
Which queues are struggling?
Are we achieving our service levels?
How many customers are waiting?
Which agents may need support?
These are operational decisions, requirin operational information; this is exactly where Dynamics 365 Contact Center reporting excels.
The information is immediate, actionable and designed to help supervisors manage the contact centre in real time.
Strategic Reporting
Strategic reporting is different because now we're trying to understand:
Why are contact volumes increasing?
What are the long-term trends?
Which customer journeys are driving the most demand?
How is contact centre performance impacting customer satisfaction?
What does performance look like across multiple business units or departments?
These aren't operational questions, they're business questions.
And from my understanidn over the years that's where Power BI starts to make a lot more sense.
My little rule of thumb that i applied when working in delivery was:
If the report helps somebody decide what to do in the next hour It probably belongs in Contact Center.
If the report helps somebody decide what to do over the next month It probably belongs in Power BI.
Now, like all rules, there are exceptions but I found it to be a surprisingly good way to separate operational reporting from strategic reporting.
Start With Decisions, Not Dashboards
Before discussing technology, visualisations or Power BI requirements, I think organisations should start with three simple questions.
What decision are we trying to make?
Who needs to make that decision?
How often do they need to make it?
Those questions are often far more valuable than discussing chart types and colour schemes, because good reporting isn't about displaying more data; it's about helping people make better decisions.
If a report doesn't influence a decision, it's worth asking whether it should exist at all.
This isn't an argument against Power BI.
Far from it.
Power BI is incredibly powerful when used for the right reasons.
In my experience, organisations typically benefit from Power BI when they need to:
Combine Contact Center data with other business systems.
Bring together CRM, telephony, finance or operational data.
Deliver executive-level reporting across multiple departments.
Analyse performance trends over extended periods.
Build advanced visualisations and analytical models.
Measure business outcomes rather than operational activities.
At that point, you're solving a very different problem from the one Dynamics 365 Contact Center reporting was designed to solve, and that's perfectly okay.
I've deliberately kept this blog focused on a simple question: When is native Dynamics 365 Contact Center reporting enough, and when should you reach for Power BI?
The deeper questions around reporting strategy, data modelling, governance, KPIs, customer insight and turning data into meaningful action deserve an article of their own.
Fortunately, I happen to know somebody who spends a lot of time helping organisations do exactly that and in my next blog, I'll be sitting down with a data superhero for a Q&A and have their take on how organisations can avoid creating dashboards simply for dashboard's sake.